Why networkformat?
Many R objects contain network structure that isn’t in a standard format. Data frames encode relationships between columns — prerequisites, co-occurrences, categorical groupings — that can form graphs. Tree-based models store splits as internal matrices of node indices. Nested lists imply parent-child hierarchies. Getting any of these into a form that igraph, tidygraph, or ggraph can work with typically means writing bespoke reshaping code.
networkformat does that reshaping for you. It extracts standard edgelists (from-to pairs) and nodelists (node attributes) from data frames, tree-based models, lists, and vectors, putting everything in the format that the rest of the R network ecosystem expects.
Quick examples
The simplest case — a vector becomes a chain of edges:
library(networkformat)

edgelist(c("start", "middle", "end"))
#>     from     to
#> 1  start middle
#> 2 middle    end
nodelist(c("A", "B", "A", "C"))
#>   name n
#> 1    A 2
#> 2    B 1
#> 3    C 1
Five lines from tree model to plot:
library(networkformat)
library(tidygraph)
library(ggraph)

tr <- tree::tree(Species ~ Sepal.Length + Sepal.Width, data = iris)
tg <- as_tbl_graph(tr)

ggraph(tg, layout = "tree") +
  geom_edge_diagonal(colour = "grey60") +
  geom_node_label(aes(label = label, fill = ifelse(is_leaf, yval, var)),
                  size = 2.5, colour = "white", fontface = "bold") +
  scale_fill_brewer(palette = "Set2", name = NULL) +
  theme_graph(base_family = "sans") +
  labs(title = "Iris classification tree")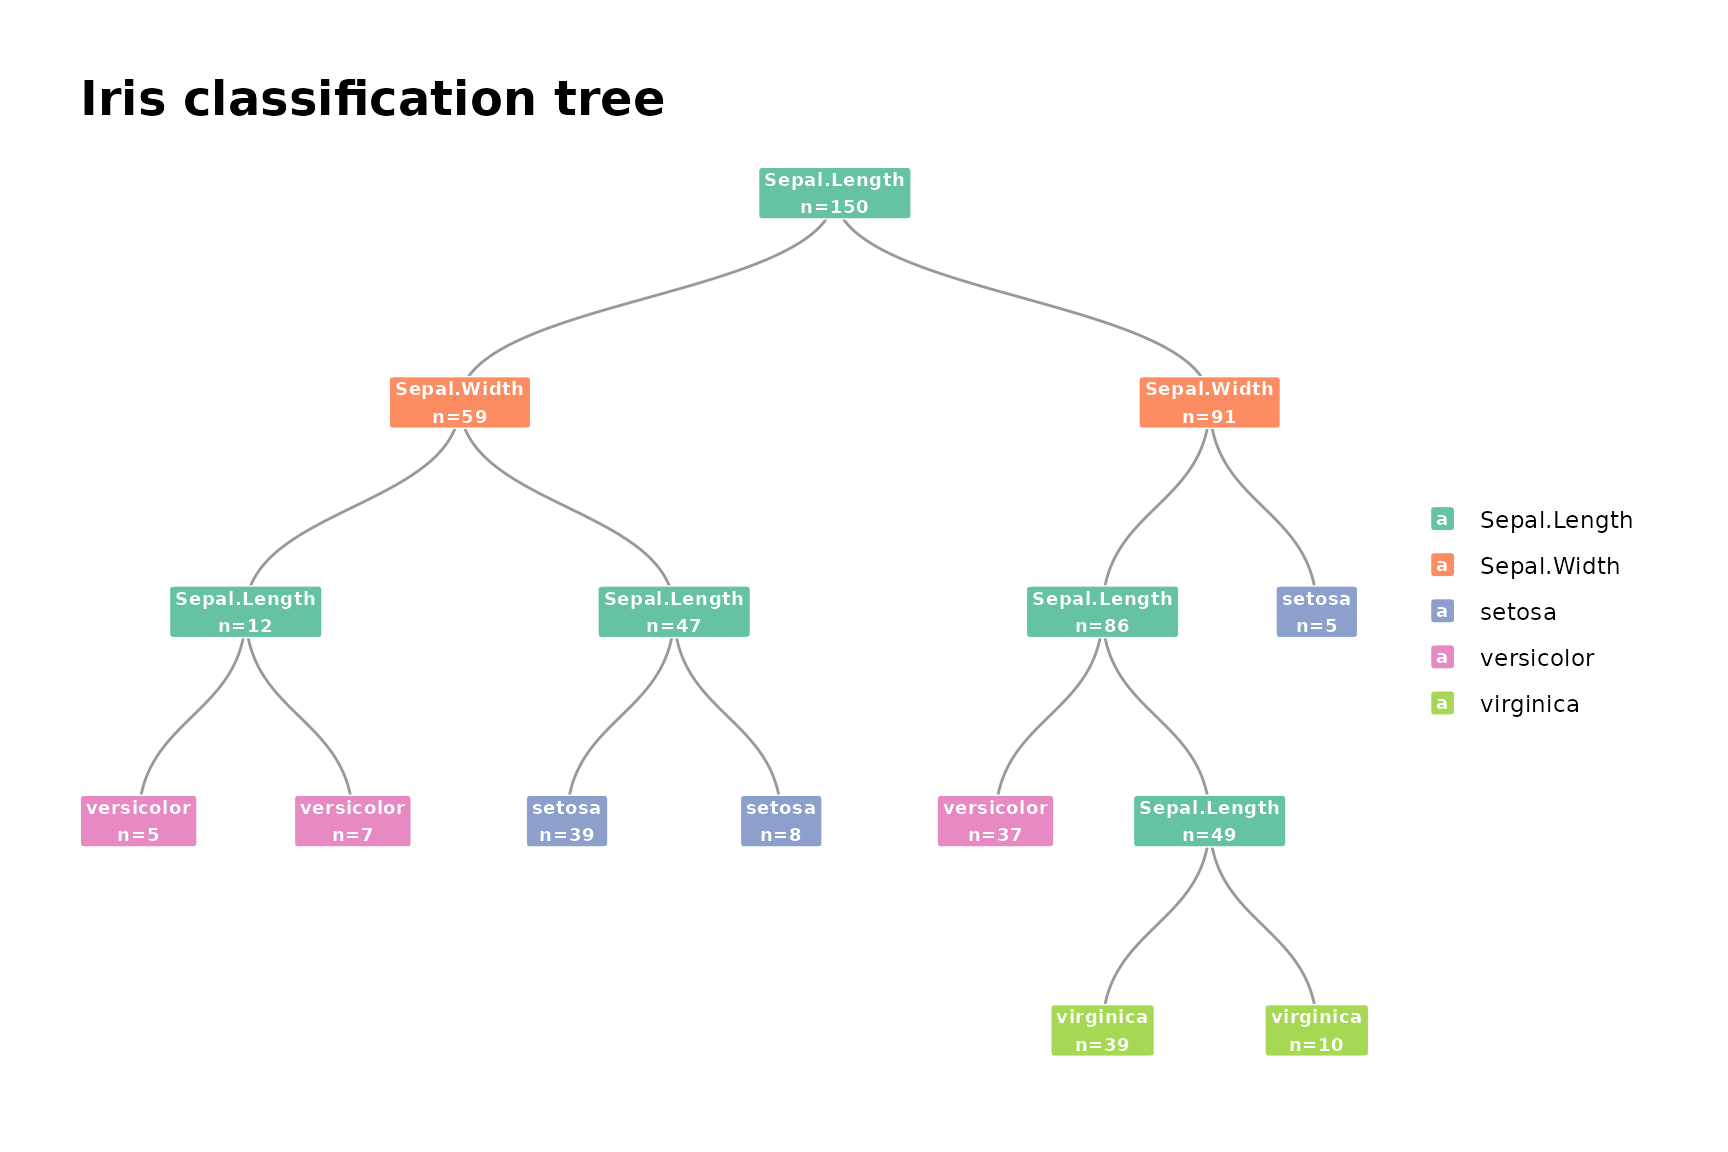
Tabular data
networkformat also works with plain data frames. The bundled
courses dataset has prerequisite and crosslisting
relationships:
library(networkformat)

# Prerequisite edgelist
edgelist(courses, source_cols = course, target_cols = prereq)
#>       from      to from_col to_col dept prereq2 crosslist credits level
#> 1  stat101 math101   course prereq STAT    <NA>      <NA>       3   100
#> 2  stat102 stat101   course prereq STAT    <NA>   math102       4   100
#> 3  stat202 stat101   course prereq STAT    <NA>   data202       3   200
#> 4  math102 stat101   course prereq MATH    <NA>   stat102       4   100
#> 5  data202 stat101   course prereq DATA    <NA>   stat202       3   200
#> 6    cs201   cs101   course prereq   CS    <NA>      <NA>       4   200
#> 7    cs301   cs201   course prereq   CS math201   math301       3   300
#> 8  math201 math101   course prereq MATH    <NA>      <NA>       3   200
#> 9  math301   cs201   course prereq MATH math201     cs301       4   300
#> 10 data301 stat202   course prereq DATA   cs201   stat301       3   300
#> 11 stat301 stat202   course prereq STAT   cs201   data301       4   300

# Node list with course as ID
nodelist(courses, id_col = course)
#>     course dept  prereq prereq2 crosslist credits level
#> 1  stat101 STAT math101    <NA>      <NA>       3   100
#> 2  stat102 STAT stat101    <NA>   math102       4   100
#> 3  stat202 STAT stat101    <NA>   data202       3   200
#> 4  math101 MATH    <NA>    <NA>      <NA>       3   100
#> 5  math102 MATH stat101    <NA>   stat102       4   100
#> 6  data202 DATA stat101    <NA>   stat202       3   200
#> 7    cs101   CS    <NA>    <NA>      <NA>       3   100
#> 8    cs201   CS   cs101    <NA>      <NA>       4   200
#> 9    cs301   CS   cs201 math201   math301       3   300
#> 10 math201 MATH math101    <NA>      <NA>       3   200
#> 11 math301 MATH   cs201 math201     cs301       4   300
#> 12 data301 DATA stat202   cs201   stat301       3   300
#> 13 stat301 STAT stat202   cs201   data301       4   300
The R network ecosystem
Once your data is in edgelist/nodelist form, a large ecosystem of packages is available, including:
igraph — the workhorse graph library for R. Handles
graph construction, shortest paths, centrality, community detection,
clustering, and much more. Also converts to adjacency
matrices (as_adjacency_matrix()) and
incidence matrices (as_incidence_matrix())
for linear algebra approaches. networkformat provides
as.igraph() methods for tree-based models
(tree, rpart, randomForest,
xgb.Booster, gbm), so you can go from model to
igraph in one step.
tidygraph — a tidy interface built on top of igraph.
Lets you manipulate graphs with dplyr verbs (mutate,
filter, arrange) while keeping the underlying
igraph structure. If you’re comfortable with the tidyverse, this is the
natural way to work with graphs. networkformat provides
as_tbl_graph() methods for the same tree-based models, and
tidygraph’s own as_tbl_graph.data.frame() auto-detects edge
data frames with from/to columns — so once you
have an edgelist from networkformat, you can pass it directly to
tidygraph as well.
ggraph — a ggplot2 extension for graph visualization, designed to work with tidygraph/igraph objects. Supports tree layouts, force-directed layouts, circular layouts, and more.
network / statnet — an alternative
graph ecosystem focused on statistical network modeling (ERGMs, latent
space models). igraph objects can be converted to network objects via
intergraph::asNetwork().
networkformat gets your data into this ecosystem. From there, you can visualize, compute statistics, fit models, or convert to matrices — whatever your analysis requires.
What’s implemented
Currently available
| Input | edgelist() |
nodelist() |
as.igraph() |
|---|---|---|---|
| atomic vector | yes | yes | no |
list |
yes | yes | no |
data.frame |
yes | yes | — |
tree |
yes | yes | yes |
randomForest |
yes | yes | yes |
rpart |
yes | yes | yes |
xgb.Booster (xgboost) |
yes | yes | yes |
gbm |
yes | yes | yes |
For data frames, tidygraph’s as_tbl_graph() already
handles the conversion from edge data frames to graph objects, so
networkformat does not duplicate that method.
Getting started
For visualizing tree models quickly, see
vignette("visualization").
For working directly with edgelists and nodelists — including all the
available arguments and the data frame workflow — see
vignette("edgelist-nodelist").